


What are the Top 5 KPIs every football analyst should track using data?
.png)
More data doesn’t always mean better decisions. In the modern game of football, analysts are surrounded by more data than ever. Every match produces thousands of data points across fitness, tactical, offensive and defensive metrics: from distances covered to passes completed, zones occupied to sprints made. But more data doesn’t automatically lead to better decisions. In fact, the sheer volume can often overwhelm rather than enlighten.
The real edge lies not in collecting data, but in knowing what to track, how to interpret it, and when it truly matters.
This is especially true for analysts and coaches working in clubs outside the “big five” leagues. With fewer resources and tighter schedules, teams cannot afford to get lost in the numbers. Apart from requiring clarity and fast turnaround times, they need the right KPIs.
Through our work with clubs, leagues, and federations across Europe and beyond, from underdog cup winners like Wisła Kraków to top-tier confederations, we’ve seen that the best analysts aren’t the ones with the most dashboards. They’re the ones who can identify which metrics truly move the needle.
That’s the shift: from static stats to dynamic context, from reports that describe what happened, to insights that explain why it happened, and what to do next.
In this article, we’ll break down the Top 5 KPIs every football analyst should be tracking, and more importantly, how to use them. Whether you’re managing player loads, evaluating tactical shape, or scouting your next opponent, these KPIs will help you cut through the noise and focus on what truly drives performance.
Distance & High-Intensity Actions in Context:

Running metrics have long been part of football analysis, but the challenge has always been interpretation. Knowing that a midfielder covered 11 kilometres is less useful than knowing that 20% of that distance came in recovery runs during the final 15 minutes of the game. Similarly, sprint counts or high-speed runs only matter if you can see whether they were timed with pressing triggers or wasted on isolated chasing.
Football is increasingly a game of repeat high-intensity actions. They are often the difference between a successful press and a broken line of formation, or between a winger beating his marker and being caught. By viewing these numbers in context, across different phases of play, zones of the pitch, or role-specific responsibilities, analysts can connect physical effort to tactical execution.
Our analytics solution makes this process seamless through our frame-by-frame tracking data (25–50 fps). It captures not just distances but also when and where bursts of intensity occurred. By assessing acceleration and acceleration metrics, physical coaches can interpret whether fatigue crept in after the hour mark or at some other point in time of a game, and whether substitutions are needed to sustain intensity across a competition.
Zones of Control & Positional Integrity:
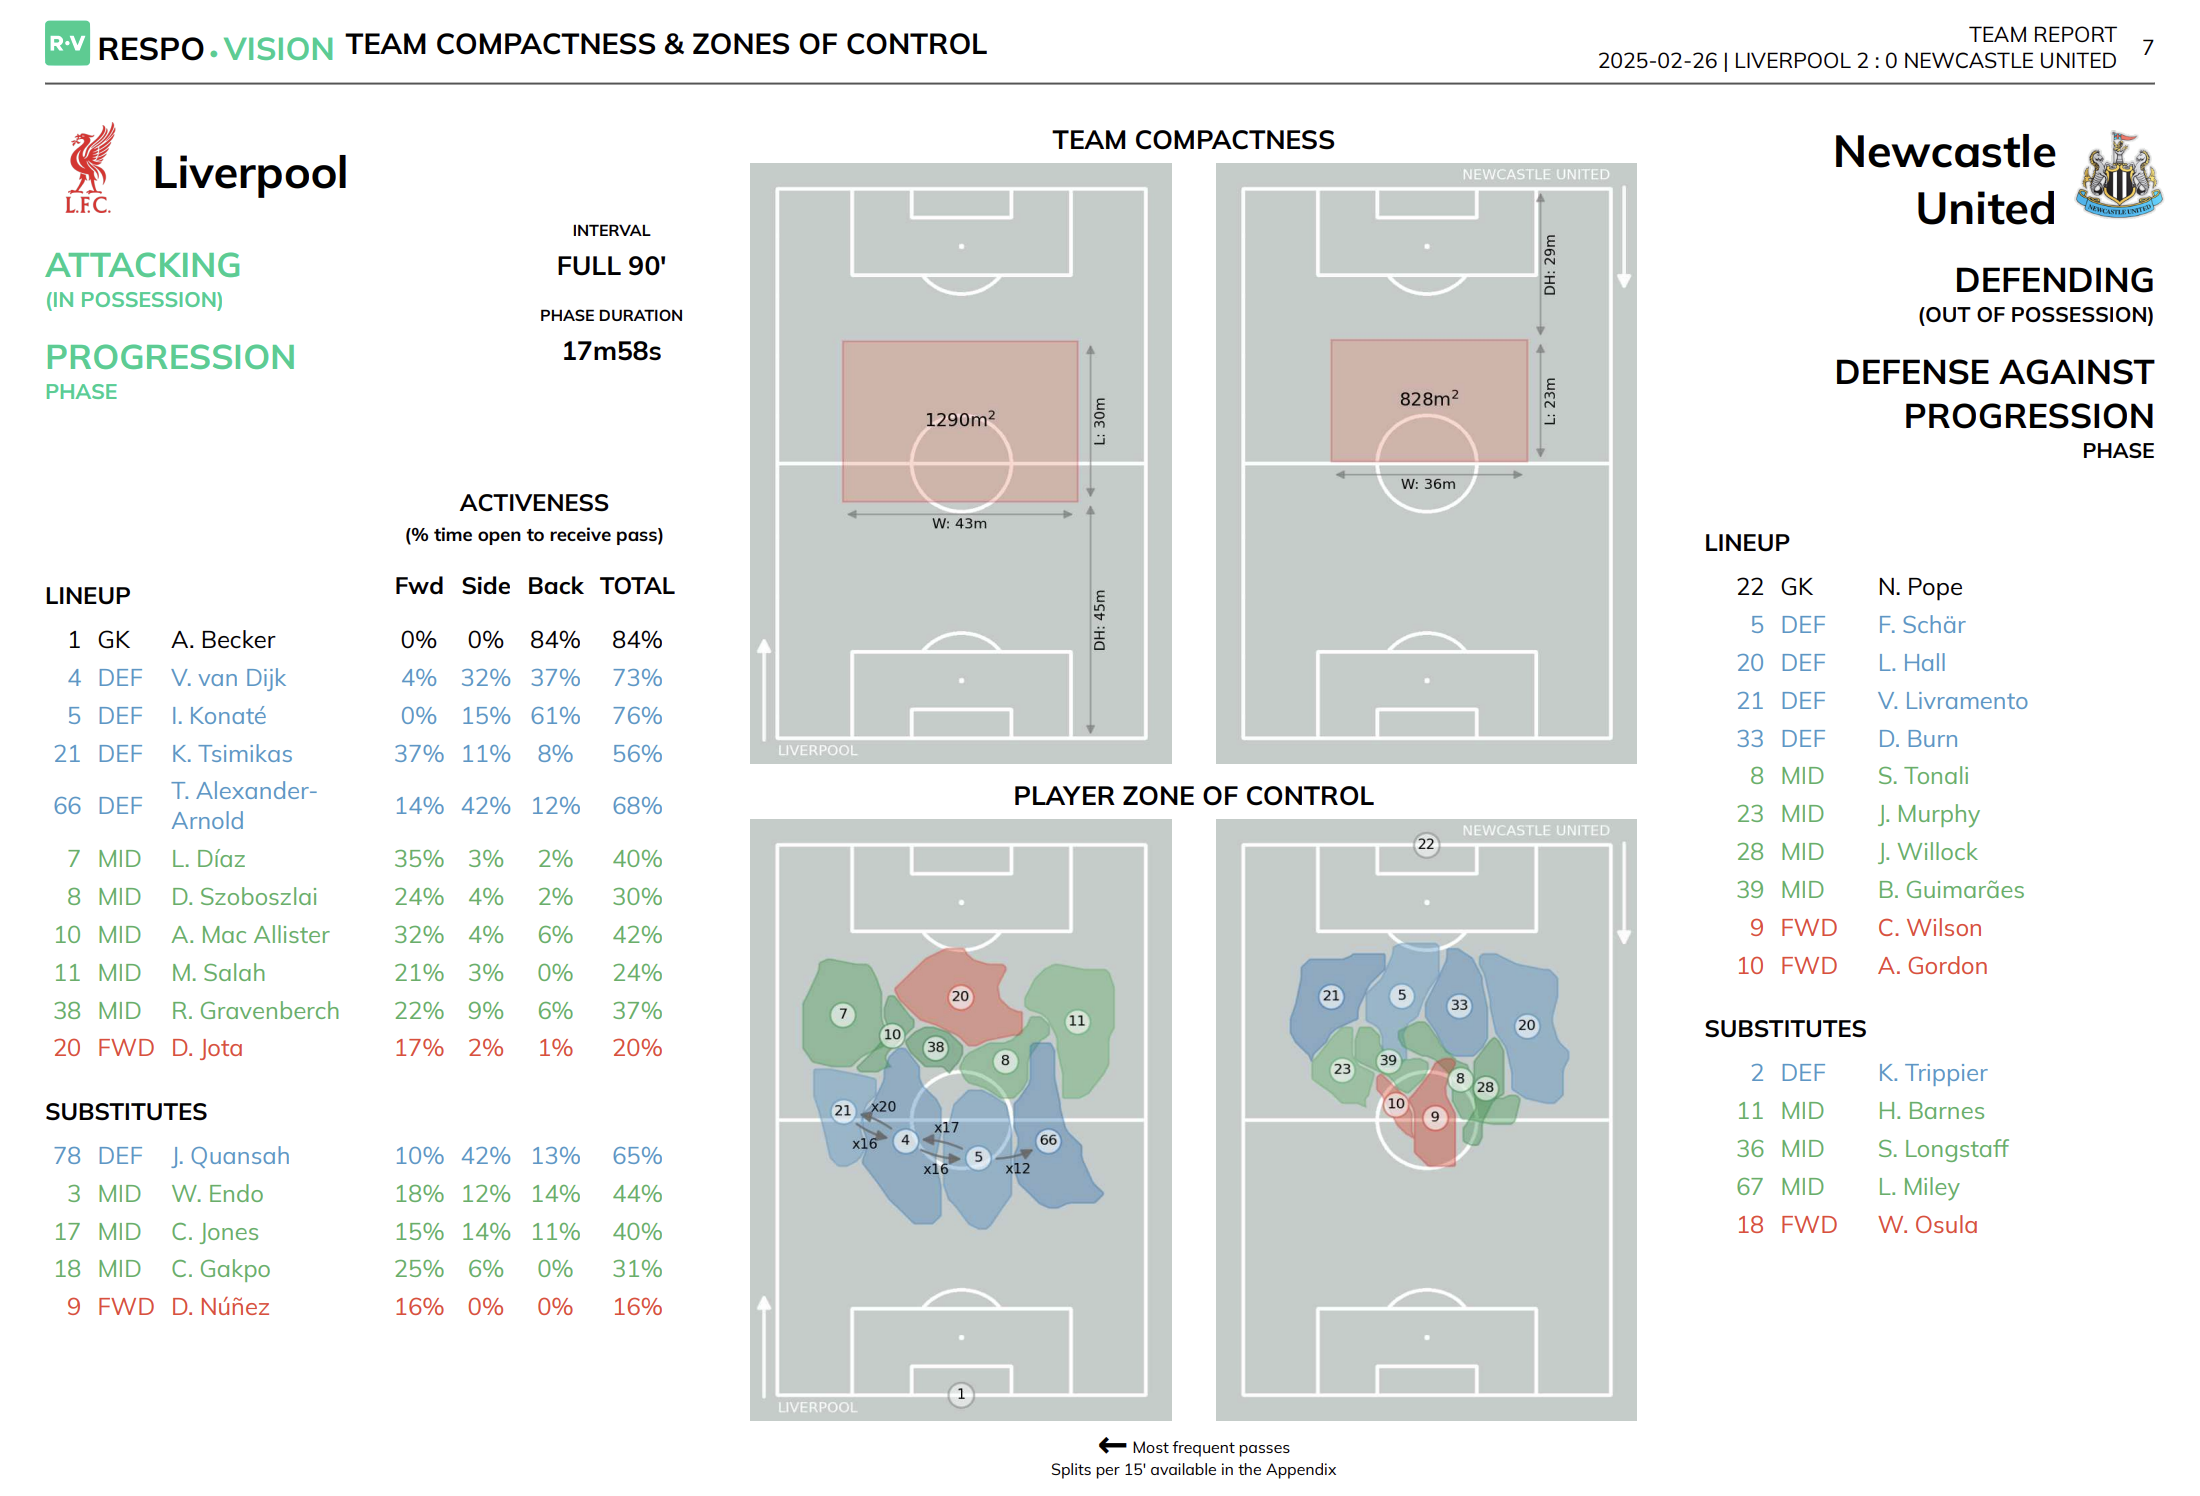
Every team begins a match with a tactical plan, but the real question is whether players actually execute it. Zones of control and positional integrity most often provide that answer. By analysing heatmaps, team compactness measures, and average individual positions, analysts can see how an inverted full-back operated as a number 6, whether they held their intended lanes, whether the midfield remained staggered as planned, or if attackers drifted into spaces that congested the system.
A single player drifting too wide can stretch a formation, creating pockets for opponents to exploit. Similarly, a lack of compactness between midfield and defence can expose channels that opposition forwards eagerly target. Positional integrity is not about rigid adherence to zones but about maintaining balance, and it often decides whether a team defends comfortably or spends 90 minutes scrambling.
Our dashboards bring this to life, showing in real time where players actually operated compared to where they were supposed to be. For coaches, this transforms vague impressions into concrete evidence: the system reveals gaps that went unguarded, and how compact or stretched the team became across different phases
Pressures Applied & Defensive Efficiency:

Pressing is one of the defining features of modern football, but simply knowing that a team “pressed a lot” tells you very little. What matters is who pressed, where they pressed, what pressing triggers they deployed (PSG showcased their strength in this aspect last season) and, most importantly, what happened next. Did the action force an error, push the opponent backwards, or result in a possession turnover? Or did it leave space exposed and allow the opponent to break through the first line of defence?
This KPI helps coaches separate productive pressing from wasted energy. A high volume of pressures without outcomes often signals poor coordination, while fewer but more successful pressures suggest smarter triggers. Analysts can also pinpoint which players are the most effective pressers and which opponents are most vulnerable when pressed against.
Instead of relying on subjective impressions, analysts can map pressure clusters, identify zones where the press worked, and adjust training sessions accordingly
Formations, Line Spacing and Shape in Transitions:
Transitions are where matches are so often decided, and line spacing is usually at the heart of it. This KPI focuses on how compact a team remains when switching from attack to defence or vice versa. Are the distances between back, midfield, and front lines tight enough to support counter-pressing, or are gaps opening that opponents can drive through? Are lateral shifts happening in unison, or do lines break into fragments under pressure?
This matters because even the most organised team can look vulnerable if spacing collapses in transition. A midfield line too far from the defence invites through balls; full-backs who advance without cover leave channels ripe for counter-attacks. Conversely, teams that maintain shape in moments of flux are much harder to break down and often regain control quickly.
Player Activeness & Involvement:

Not every contribution shows up in goals, assists, or even touches. Some of the most influential players are those constantly making themselves available, offering passing lanes, or stretching defenders with runs off the ball. This KPI captures that hidden side of the game, how active a player was in presenting options, moving into space, and influencing play without necessarily being on the ball.
It matters because modern roles, from inverted full-backs to free eights, demand constant involvement in ways that don’t always appear in traditional stats. A midfielder who consistently opens passing lanes may dictate tempo even if he records only 40 touches. Likewise, a forward whose movements drag centre-backs wide can create scoring opportunities without ever being credited in the buildup.
With our tracking data, we shine a light on these ‘invisible’ actions. By recording proximity to play, orientation, and off-ball runs, the system shows how “present” a player was in shaping the game. This gives analysts and coaches a new lens for evaluating roles that are otherwise underappreciated
ReSpo.Vision's takeaway:
Football is not just faster than it used to be, but it has become much more intuitive. Matches are won not just by talent and tactics, but by the quality of decisions made before, during, and after the game. And those decisions increasingly rely on data.
But data by itself has no voice. It needs interpretation, context, and above all, clarity. That’s why the role of the analyst has never been more critical, or more complex. You are expected to turn thousands of data points into a clear picture of performance, fitness, structure, or threat.
You’re not just measuring the game, you’re making sense of it.
The five KPIs we have explored aim to form a foundation for coaches. They help analysts identify breakdowns in team shape, measure the impact of pressing actions, monitor recovery, and map tactical tendencies. When tracked consistently and framed correctly, these KPIs become part of a club’s internal language, shared across coaches, players, and support staff to drive a more informed, united approach.
At ReSpo.Vision, we see our mission as opening up new layers of the game that were once invisible. Our technology adds precision and depth to performance analysis, revealing patterns, behaviours, and tactical nuances that traditional tools couldn’t capture. The amount of data out there will keep increasing. Our role is to make that data as legible and comprehensible as possible, something that was never the case previously
Because the true power of data lies not in how much of it you collect, but in how deeply it allows you to understand the game. And when analysts focus on the metrics that matter, they enable themselves to actually shape performance, more than just tracking it.

